

Latest Weather Blog
Super El Nino and the Capital Area: An In-Depth Storm Station Study
A climate pattern commonly referenced as Super El Niño is developing and set to break global records. More potent than a typical El Niño, this shifting pattern has already shaped hurricane season and could sway global weather well into 2027. The Storm Station has conducted an in-depth study to analyze what has happened in the past and outline what could happen during the weeks and months ahead across the Capital Area.
Understanding ENSO and Why It Matters
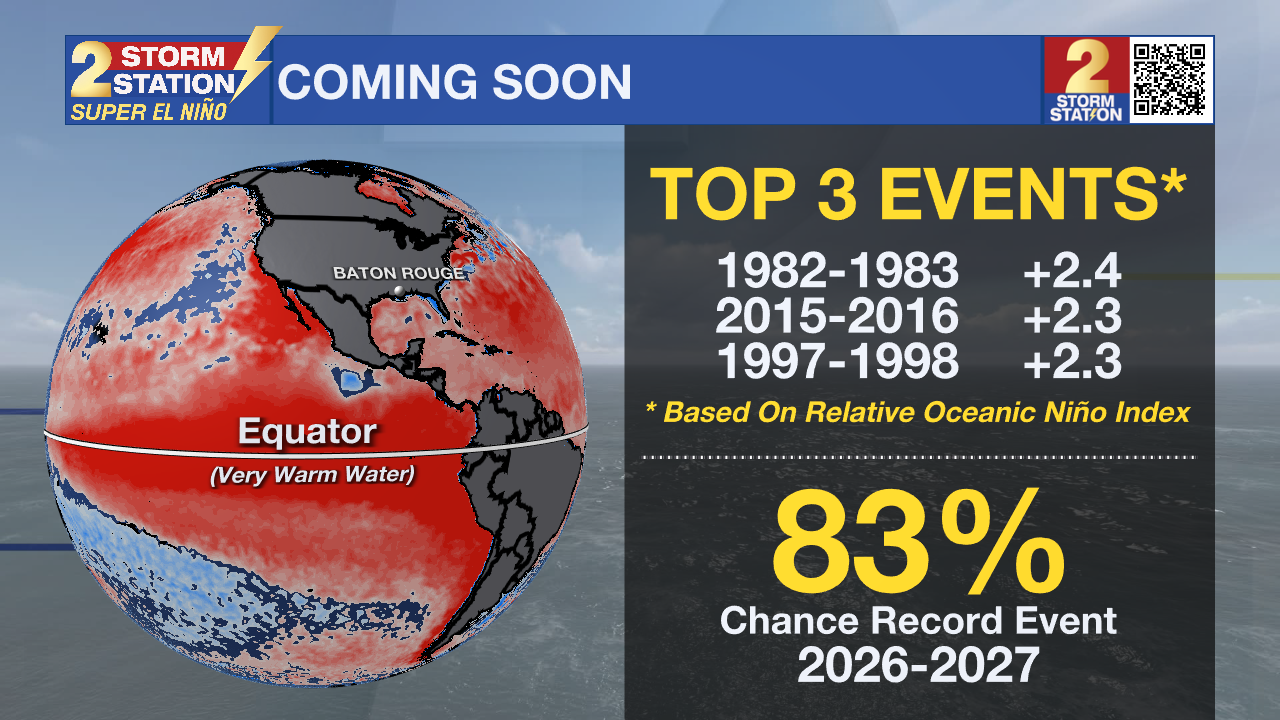
The El Niño-Southern Oscillation, or ENSO, is a natural climate pattern driven by changes in Pacific Ocean water temperatures near the equator. When these ocean waters warm up significantly, we enter the warm phase known as El Niño.
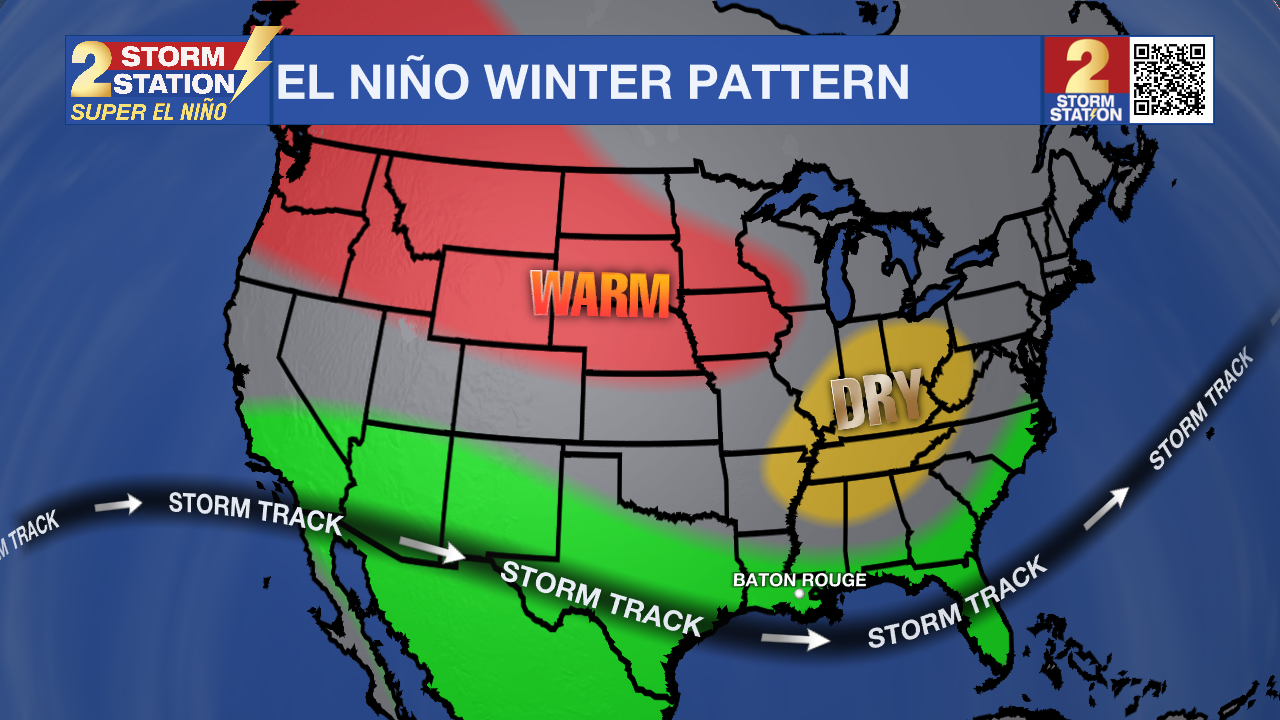
Though this warming happens thousands of miles away, ENSO matters deeply because it shifts high-altitude wind currents. These wind currents are a major driver for storm tracks across North America, so when their paths shift, typical weather patterns change as well.
Trending News
ENSO is measured with a simple numerical index. When conditions are near average in the region where ENSO is measured, the index sits closer to zero. Positive readings, primarily above 0.5, represent an El Niño. Negative numbers, dropping below -0.5, represent a La Niña.
The index has been measured since 1950. The index has gone above 1.0 on 15 occasions in that time to mark a moderately strong El Niño event. Only four El Niño events have exceeded 2.0. These events are classified as Super El Niño. They occurred in the winters of 2015-2016, 1997-1998, 1991-1992, and 1982-1983.
The 1982-1983 El Niño was the strongest on record, 2.4. This winter, the index is expected to go well beyond that, breaking a record and potentially reaching a staggering mark between 3.0 and 4.0.
ENSO events typically develop during the spring or summer in terms of abnormally warm sea surface temperatures in the central-eastern equatorial Pacific. The waters continue warming through the fall and reach a peak during winter – December, January, and February (DJF). Climate researchers therefore use the index during that DJF window as the key measuring period.
Global weather impacts are most notable in the wintertime. After this peak period, the El Niño conditions usually begin to revert toward average (zero) during the following spring and summer.
Read on to see what all of this means for Metro Baton Rouge, including southeast Louisiana and southwest Mississippi. Storm Station Meteorologists analyzed localized climate history along with the past ENSO index to break down the impacts these patterns have caused in the past and what may be in store for the months ahead.
Effects on Temperatures
There is a moderate relationship* between El Niño and cooler-than-average winter temperatures in the Metro Baton Rouge Area. The overall winter average temperature is 53.3°F, but moderately strong El Niño events average a chillier 51.5°F.
The top four coolest winters on record in Baton Rouge (1978, 2010, 1964, and 1977) all took place during El Niño events. Additionally, three of the top five coolest Februaries happened during a moderately strong (index over 1.0) or Super El Niño (index over 2.0).
Of the 15 moderately strong or Super El Niño events on record, only 6 of them produced winters that were definitively cooler than average. Actually, Super El Niño actually averaged slightly warmer overall winter temperatures at 54.1°F, and the Super El Niño of 2016 brought the 13th warmest winter on record.
March shows the highest frequency for cool extremes, with 5 out of 15 moderately strong or Super El Niño events dropping temperatures below normal variability. May showed no sign at all of cool extremes.
Effects on Precipitation
There is a moderate relationship* between El Niño and wetter-than-average winters in the Metro Baton Rouge Area. This association is slightly stronger than the one for temperatures. While the average winter precipitation is 15.6 inches, moderately strong El Niño events average 18.7 inches, and Super El Niño events jump up to 22.2 inches.
4 of the top 6 wettest winters on record occurred during El Niño. Two of those winters occurred during a Super El Niño event.
January sees a significant boost during Super El Niño events, averaging 9.2 inches of rainfall compared to the monthly average of 5.4 inches. May is the only month that trends slightly drier during these events, though it stays within normal variability.
Cold Impacts: Snow and Freezes
Many assume that with El Niño events producing cooler and wetter-than-average winters, the chance for frozen precipitation must increase. However, in a region so rarely affected by snow and ice, that is not the case.
There is no relationship* between freezing temperatures and El Niño. On average, the Capital Area hits freezing in a range of 12 - 28 times per season. Out of 15 moderately strong or Super El Niño events, only three produced a freeze count above the normal range. An outlier among moderately strong El Niño events was 1977, which holds the record for the most freezes in a single winter at 37.
There is also no relationship* between snow and El Niño. Not accounting for the possibility of missing data, either snow or sleet has been observed approximately 51 times in Baton Rouge, only occurring in December, January, February, and once in March. El Niño was in place during 35% of those observations. La Niña was in place for 25% of those observations. The other 40% of snow or sleet observations occurred during a neutral period without El Niño or La Niña.
It seems counterintuitive that the cooler and wetter winters would not be more likely to produce freezes and snow. However, the next section explores the meteorological explanation for this curious blip in the data.
Data Doesn’t Tell The Whole Story
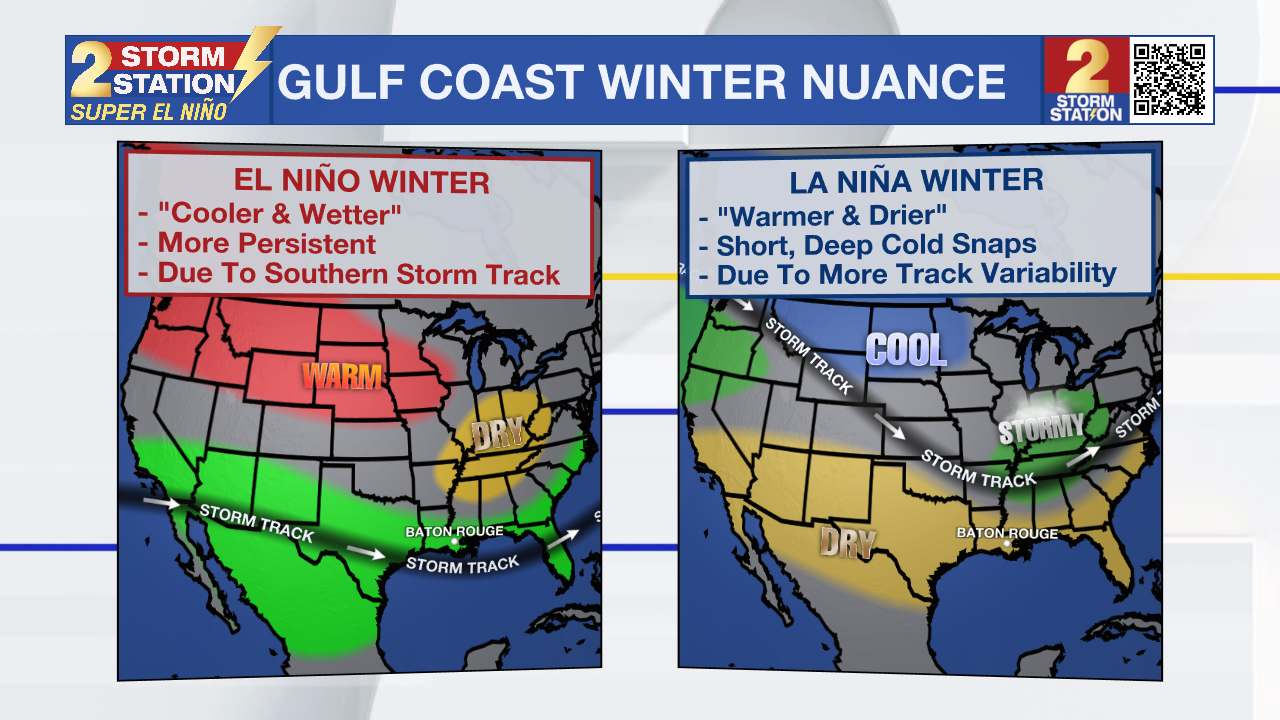
Indeed, El Niño events often produce cooler and wetter winters, but these tend to be more persistently unsettled thanks to the high-altitude wind currents sending storm systems across the region. Since the wind currents are somewhat more stubborn, the associated clouds and precipitation keep temperatures below average, but invasions of very cold air are less likely.
On the other hand, La Niña events work out to be warmer and drier winters, but those are prone to bigger swings in weather because the high-altitude wind currents buckle with more north-to-south variability. When the currents are north, long warm and dry spells can occur, which make La Niña winters a bit warmer and drier on the whole. However, when the currents are south, short-lived deep cold snaps can occur.
Effects on Severe Weather
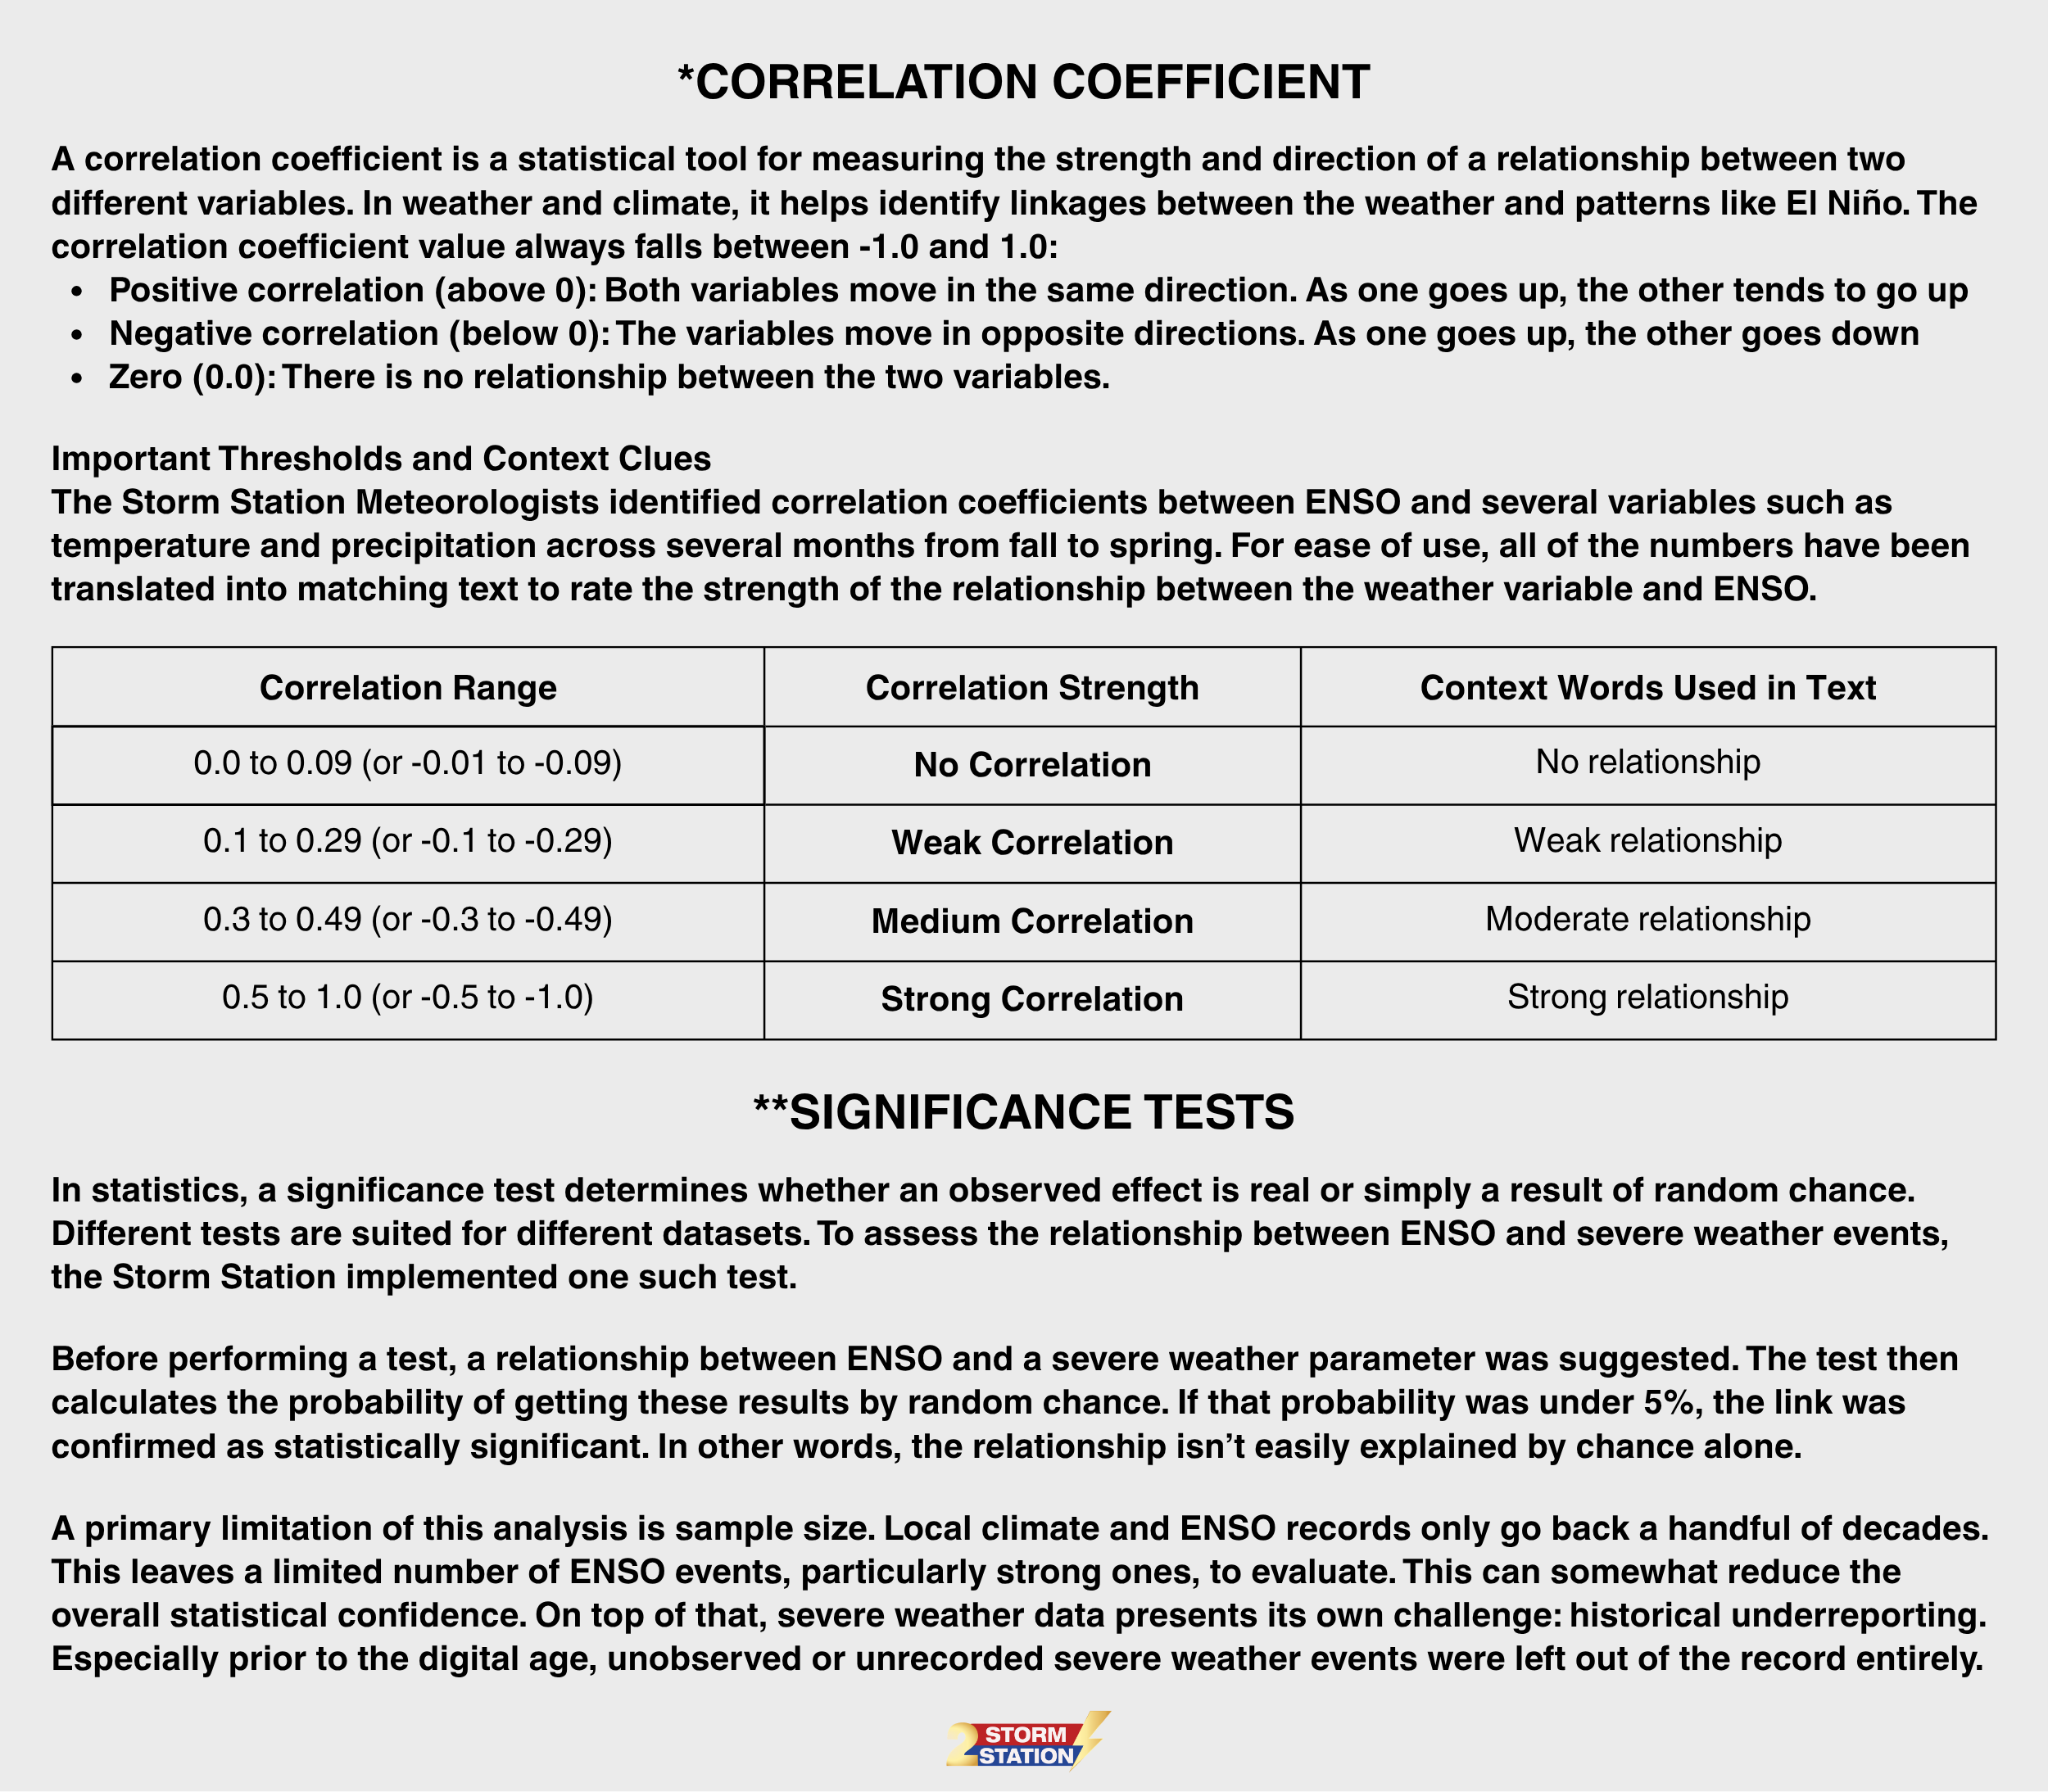
The relationship** between ENSO and severe weather is much more nuanced than the relationship** to temperatures and precipitation. Its influence varies significantly depending on the time of year and the specific hazard, whether it be tornadoes, damaging wind, or hail.
Importantly, there is not a strict cause-and-effect relationship** between ENSO and severe episodes, but it can create environments more or less favorable for them. Some broad seasonal patterns and associations do stand out, and this study identified all known tornado, thunderstorm wind, and hail events within the 13-parish, 2-county Storm Station Forecast Area.
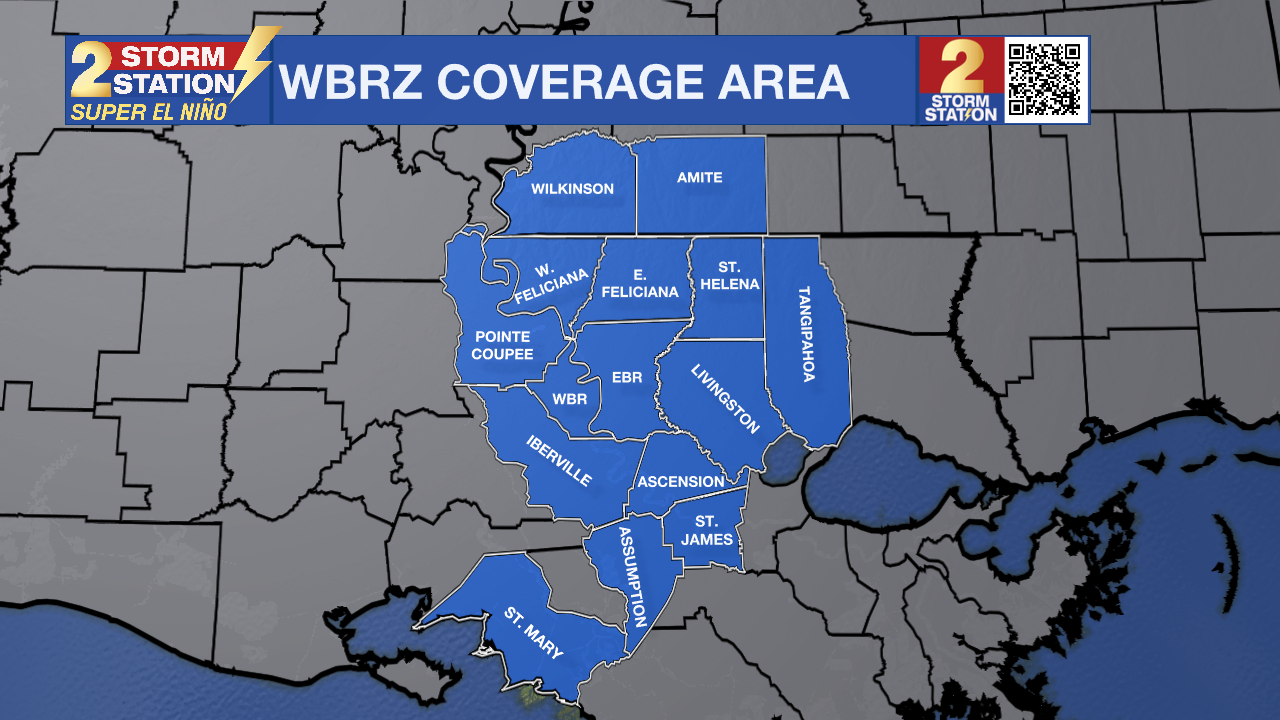
Although the severe weather records extend back to 1950, wind and hail analyses are restricted to 1980 onward due to substantial reporting deficits in prior decades. While tornado records likely share an underreporting bias as well, the historical contrast was less stark, justifying the inclusion of data all the way back to 1950.
Tornadoes: There is a clear relationship** between tornadoes in the Baton Rouge area and ENSO, but it changes by season. El Niño stands out with higher tornado activity in the fall, whereas La Niña takes over in the winter and spring.
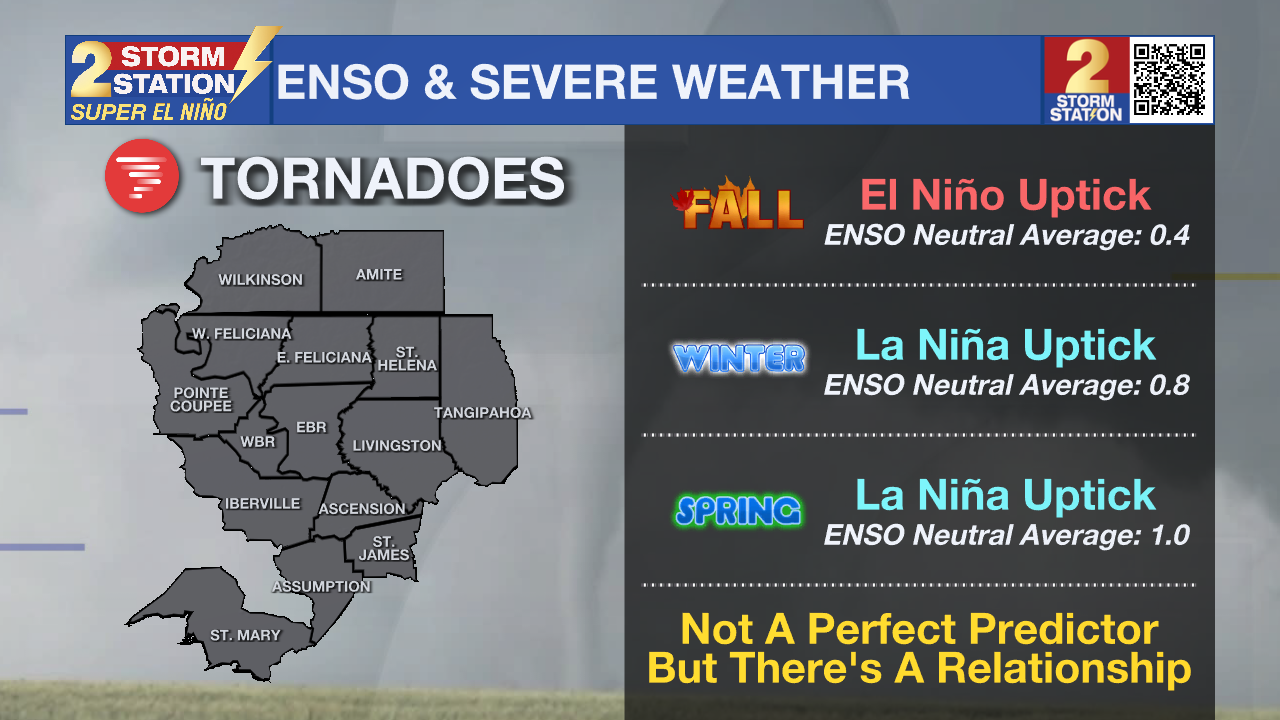
Autumn tornadoes are relatively rare across the Capital Area. The region averages just 0.8 tornadoes between October and November, a baseline that drops to 0.4 without El Niño or La Niña. In other words, many autumns pass without a single twister. However, an El Niño pushes that fall average up to 1.2 tornadoes, a statistically significant uptick. Even with that boost, actual numbers remain low given the rarity of fall tornadoes. La Niña conditions, by comparison, showed no clear impact on fall activity.
Winter tornadoes (December through February) are slightly more frequent, averaging 1.3 per season since 1950. La Niña drives that number even higher to an average of 2.2, a statistically significant surge. By contrast, El Niño winters showed no meaningful increase.
Tornadoes are most common in the spring as warming temperatures and wind shear overlap. Rising temperatures supply the fuel severe storms need, whereas wind shear provides the boost to get them organized and rotating. In neutral years without an active El Niño or La Niña, spring averages just one tornado. La Niña pushes that mark to nearly three, a statistically significant** jump. While El Niño also elevates the average, its impact was not statistically significant**.
Damaging Wind Events: As was the case with tornadoes, there is a relationship** between ENSO and damaging wind events. El Niño is associated with more events in the fall, whereas both El Niño and La Niña are associated with an increase during the winter. The spring signal is much weaker.
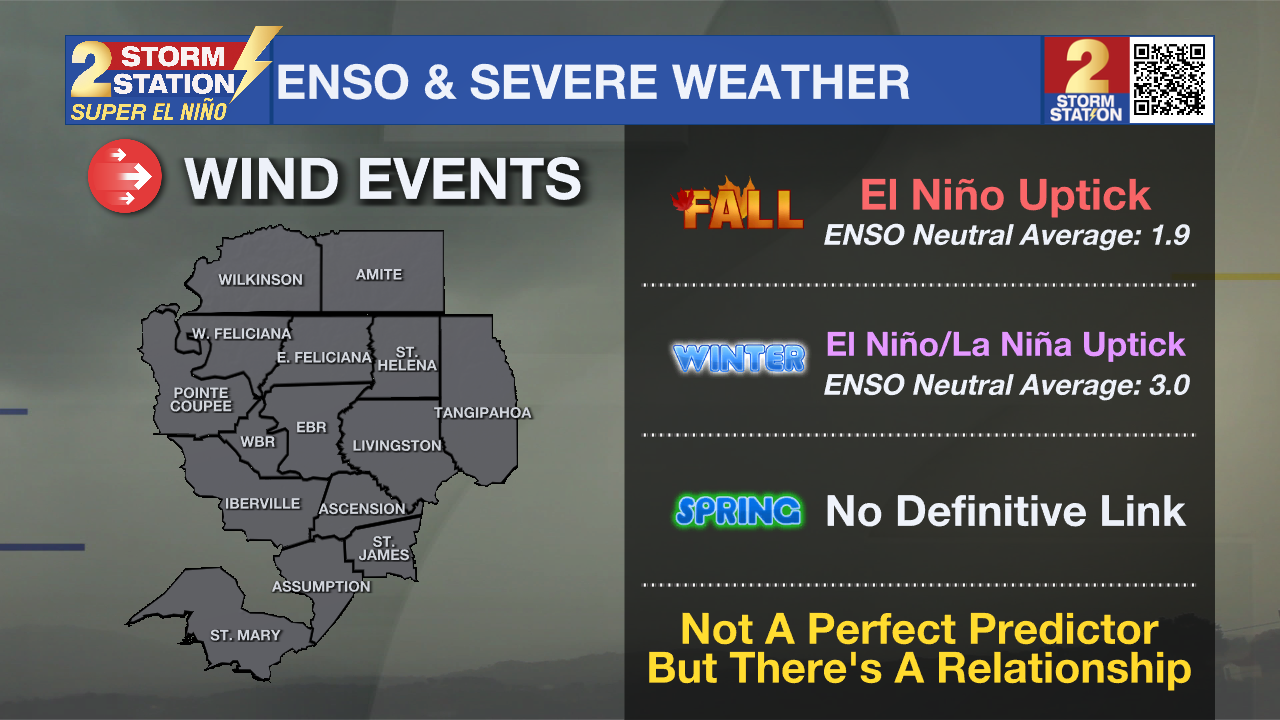
Instances of damaging wind are not very common in the fall, at least relative to warmer months. In La Niña and ENSO-neutral years since 1980, the Capital Area averages only one to two events across October and November. However, the Capital Area averages four to five straight-line wind events during the fall months when El Niño is ramping up. Historical data show this increase is statistically significant**.
Neutral winters (without El Niño/La Niña) averaged three high-wind events per season. However, there was a statistically significant** increase of six to seven damaging wind events during both El Niño and La Niña winters.
Although El Niño and La Niña were associated with slightly more spring wind events than years without, their exact impact remains unclear. The data alone couldn't establish a definitive link.
Hail Events: El Niño and La Niña show no statistically significant** link to fall and winter hail activity. Spring is a different story, however, as both are associated with a big boost in hail events.
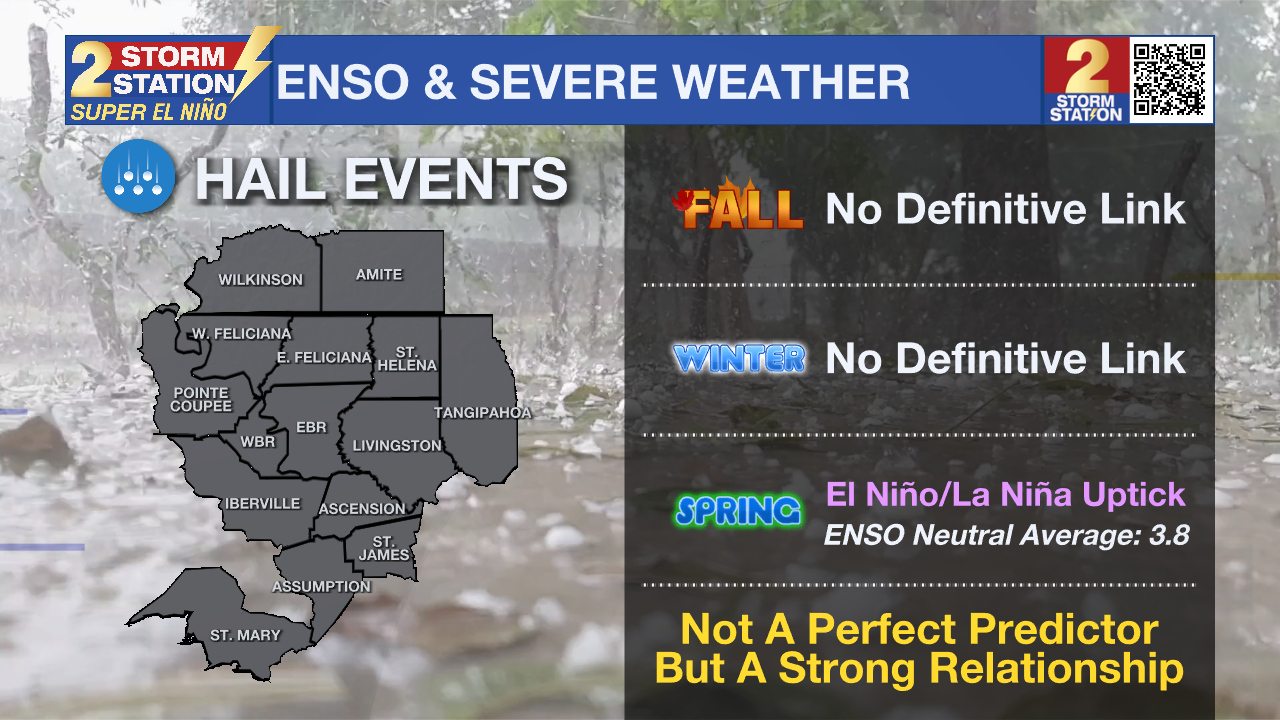
Following El Niño and La Niña winters, the Capital Area averages approximately 9.8 and 8.2 hail reports, respectively. This is a stark contrast to the average of around 3.8 when lacking an El Niño or La Niña.
Summary
El Niño is not a weather feature or a storm system. It is a climate pattern that has statistical links to certain types of weather, not guarantees. For example, if a football team is without a starting quarterback due to injury, a loss may be more likely, but it is not a guarantee. El Niño is like the quarterback and weather is like the football team – one influences the other but doesn’t control it entirely.
All of the weather trends are relative to average. Seasonal variability is still expected, and as in any winter, there will be cooler and wetter periods and warmer and drier periods. However, over the course of several months, the statistics favor cooler and wetter conditions than average.

The Storm Station is here for you, on every platform. Your weather updates can be found on News 2, wbrz.com, and the WBRZ WX App on your Apple or Android device. Follow WBRZ Weather on Facebook and X for even more weather updates while you are on the go.
More News

